Time Management
Efficient Time Management with BI-Dashboards
Your project schedule may be ever so detailed and optimised. However, if you do not follow up on it, it isn’t worth much.
At Exigo, we believe that there is a difference between planning and time management. Whereas planning involves creating detailed schedules which make the most of the construction site – e.g. an optimized location-based schedule – , time management means following up on your progress. For instance, do you meet your deadlines?
Exicute Cloud Platform gives you a quick and visual overview of how things are going. Because, when we follow up on progress per activity per location, it becomes much easier to spot challenges and make adjustments in time. This way, we minimize the risk that a problem will delay the whole activity and perhaps ultimately delay the entire construction.
Read the progress “live” at construction meetings
The Exicute Cloud Platform gives you a quick and visual overview of the state of your schedule and progress. Then you can save time at meetings where you can concentrate on other important things, because you already have control over how far you are with the construction.
The BI-dashboards let you keep track of:
- the day-to-day progress of the construction project compared to the plan
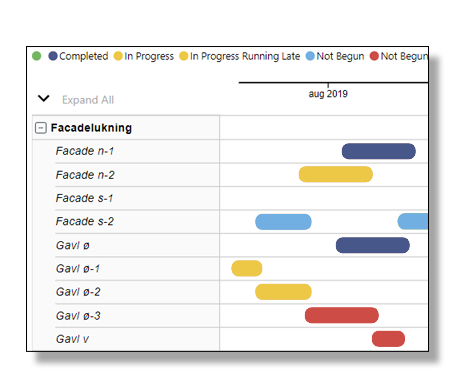
- which locations are on time, behind or ahead of schedule
- where each subcontractor should be working at a given time
What is unique about our BI-solution for construction is that our analyses automatically combine time and finances. This gives you an overview of your project’s finances over time and not just an illegible spreadsheet with red text everywhere. So, check out our dashboard-solutions for financial management.
On this page, you get a brief introduction to each of the dashboard views that help you with time management. Please get in touch, if you want to know more.
Project Overview – Time Management
The Project Overview dashboard gives you a quick overview of the project’s most essential KPIs. Here you can see a graph of construction progress over time in relation to the planned construction progress.
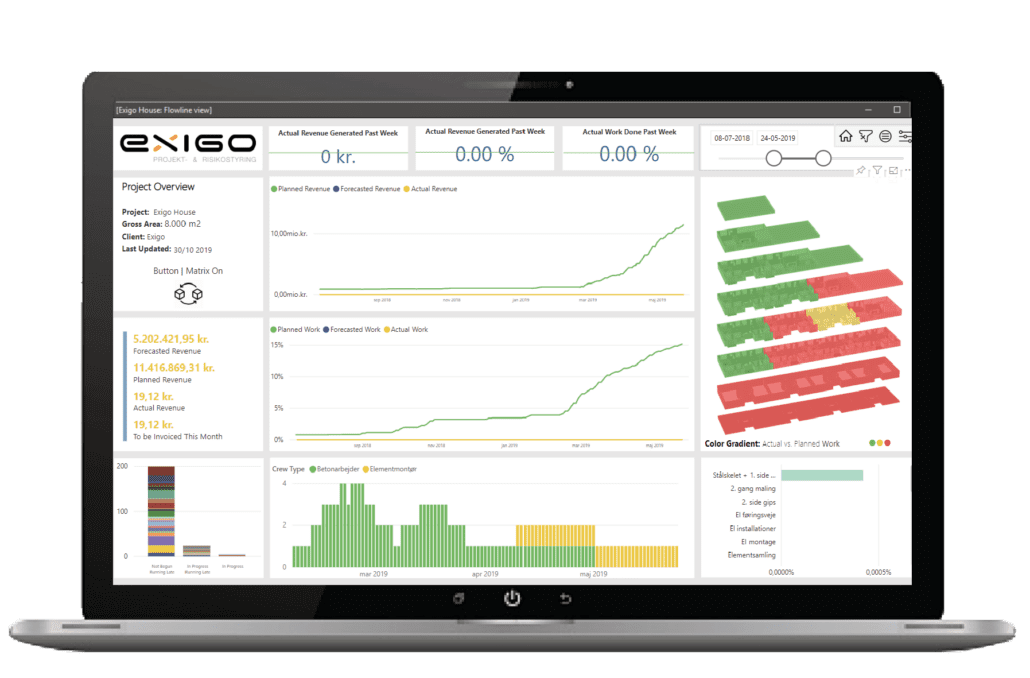
Counter showing you the current estimated revenue, planned revenue at the time, and forecasted total revenue.
Today’s actual and planned progress and revenue. Did you get your money’s worth?
Graphs showing turnover and construction progress over time, including forecasts.
The Crew Type-graph shows you which crews are active on the site at a given time.
Illustration of the level of completion of each location. Click any location to filter all the data by that location.
Documentation and Overview
The dashboard offers strong visual analytics and makes intuitive sense to most people. It makes it easier to discuss the building process in meetings when you know that everyone is on the same page.
Keep track of:
- the progress (%) of each activity
- the overall progress (%) based on location
- a visualisation of the level of completion of each activity
- a status report on project finances – how much of the budget has been spent at a given time?
- forecasts for progress and finances – are you likely to make it on time and on budget?
Most noteworthy, the date-filter enables you to scroll through time. In this way, our BI-dashboards also function as documentation of the construction process. For instance: Unsure about exactly what caused a specific delay? Easily spot its cause by rewinding your project data to the onset of the delay.
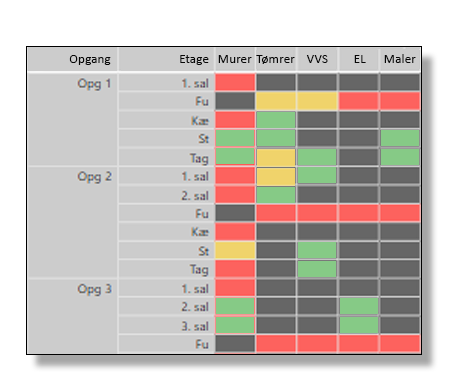
Progress Matrix
The dashboard-view ‘Progress Matrix’ shows you a table of activities based on location. The colour-coding quickly lets you know if that specific activity on that specific location is either ‘on-time,’ ‘In progress, delayed’ or ‘not in progress, delayed.’
You decide how to filter the views, for example by location, activity, discipline or time.
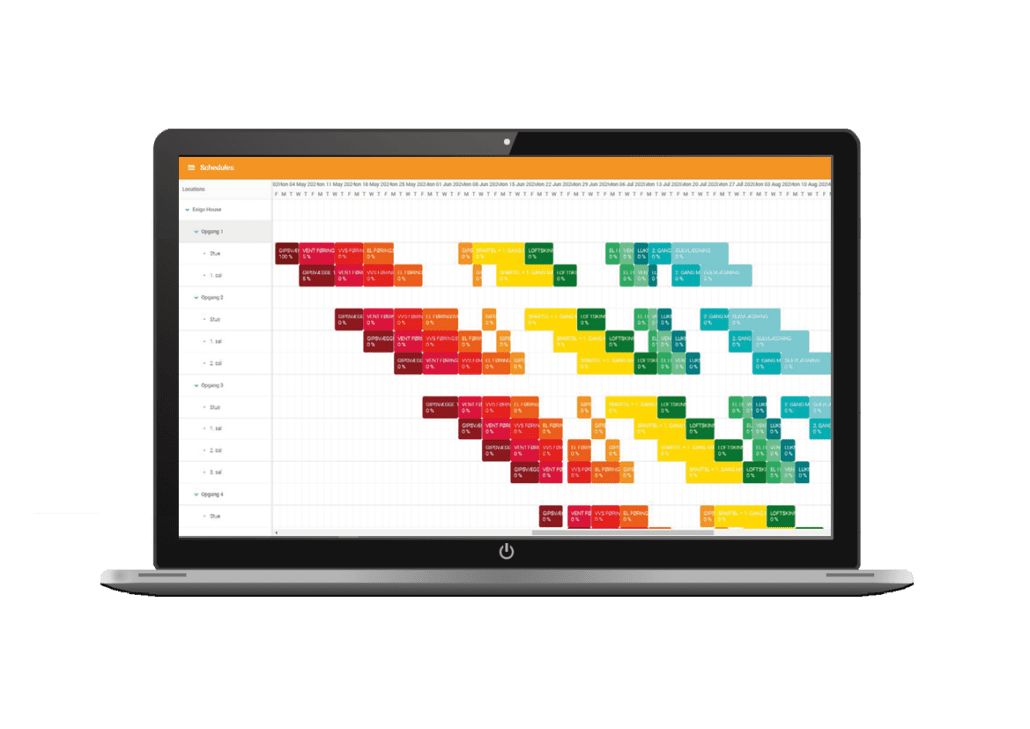
Gantt- and location-based scheduling
With our BI-dashboards at hand, you can quickly and easily communicate the current plan to all your partners. If changes are made to the schedule, this will be displayed on the dashboards, and you will always have access to the most recent information.
The dashboards may be accessed by tablet or smartphone, so you don’t have to carry around large, unwieldy print-outs on the construction site.
Simply click on any location or activity in order to zoom in.
Effortless communication of the schedule
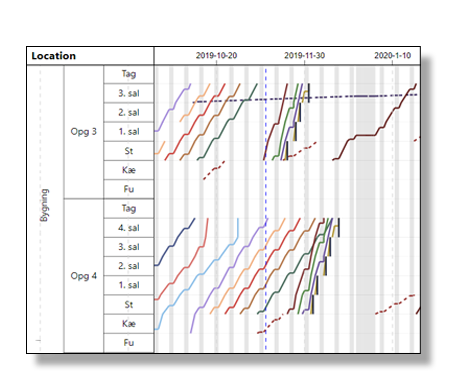
In order to facilitate time management and effortless communication of the schedule, we have included a toggle between Gantt-schedule and Flowline. Almost all people have different preferences for how they like to read their schedules. With the toggle, this is no longer a problem.
To sum up, having the location-based schedule close at hand makes it easier to discuss changes to the plan and gauge the probable consequences of changes.
You can also connect you schedule from Tactplan to Exicute.
On-site Progress Reporting
In order to use our dashboards for effective management of your construction project, you need continuous updates on progress.
To this end, we developed the app Exicute, which enables on-site progress reporting.

